
This article tells you how to use the charts and text answers to identify problem areas on your website.
One of the main advantages of our surveys it that they can help you to identify problem areas on your website, and you can use that information to improve the user experience. There are two main ways to identify problem areas: cross-tabulations and text answers.
Cross-tabulations
We offer cross-tabulations in our platform, which means that you compare the relationship between two questions. However, you can only compare your question of choice with one of your KPI questions (find score, ratings and NPS). For the problem identification, you should cross-tabulate your role and purpose questions with the find score. That way, you will get the find scores for each role and purpose without having to create segments for each. If you are new to cross-tabulations, you can read more about them here.
The cross-tabulations are designed to help you with the analysis, see example below. The horizontal line is automatically placed at the limit for approved, which is 50 for find scores. All roles or purpose above the line have approved scores while the roles or purposes below do not have approved scores. The vertical line is automatically placed halfway between the biggest and smallest role or purpose.
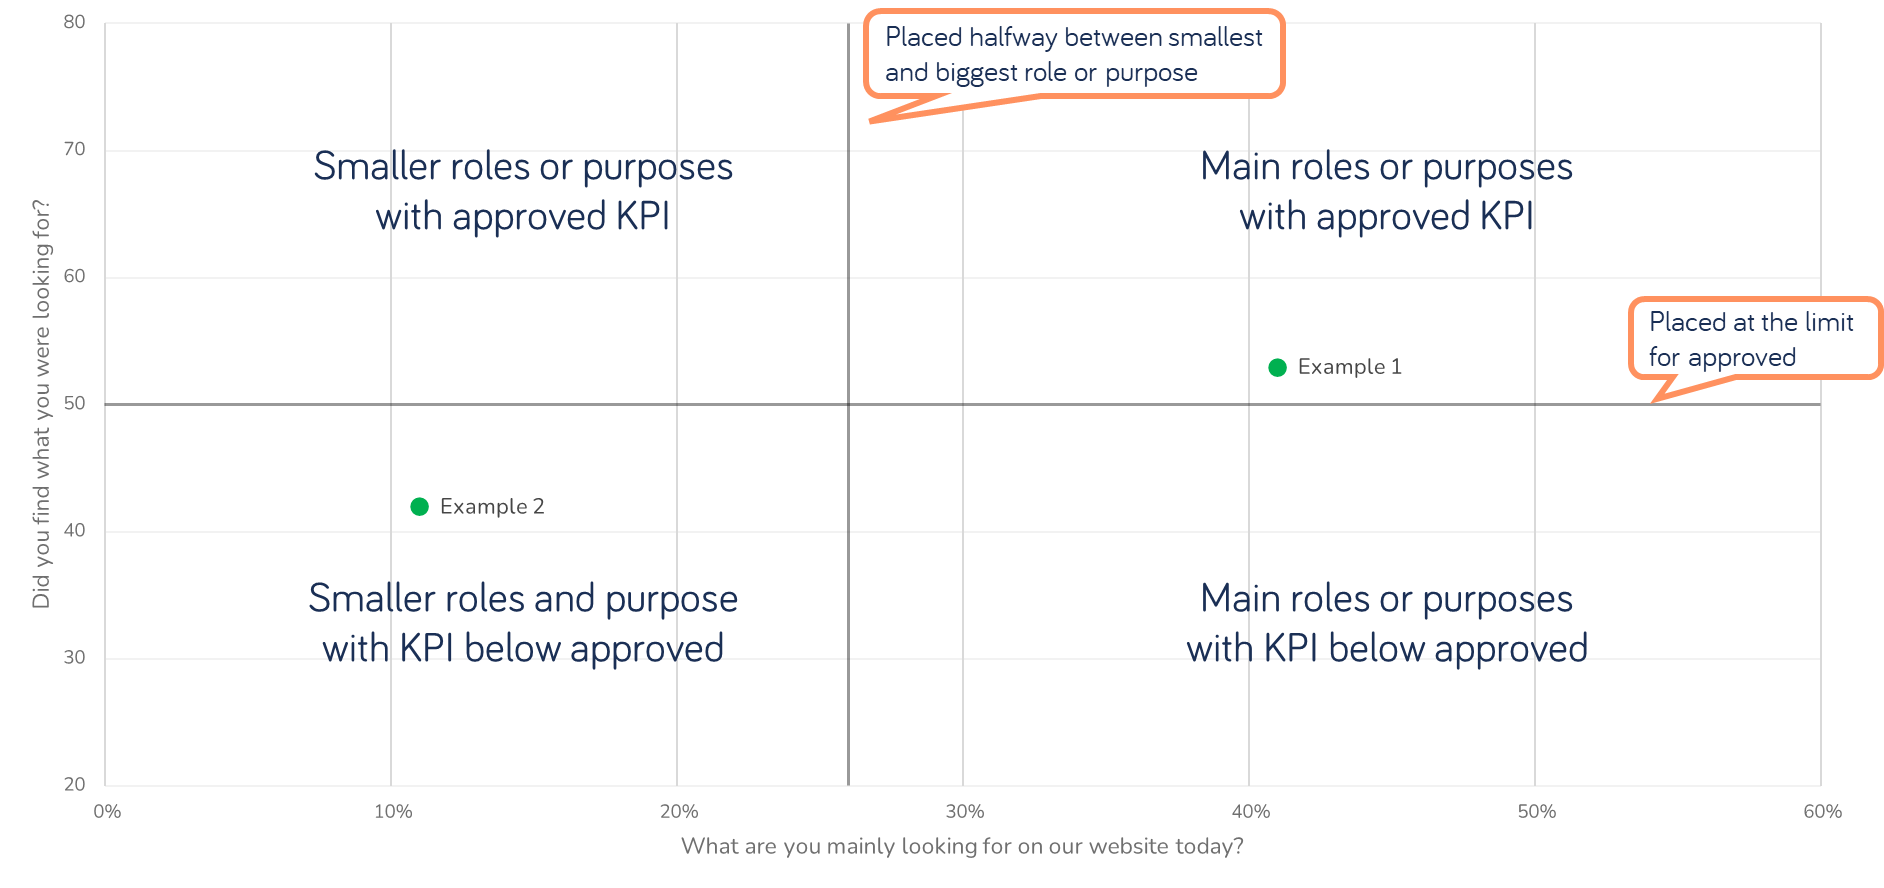
The lines create four quadrants. The bottom right quadrant are large roles or purpose with low find scores, and these are therefore problem areas you should focus on first. The bottom left quadrant also contains problem areas, but these are smaller and therefore less urgent.
By using cross-tabulations, you can easily identify roles and purposes with low find scores. In the example above, we can see that "Member, teacher" is a big role with a low find score, and they should therefore be prioritized. "Trustee" is a smaller role, but they also struggle to find. They can therefore usually be prioritized lower.

If you find a role or purpose with a low find score that you want to investigate further, you can create segments based on them. Just click on the role or purpose you want to base a segment on, and the settings will automatically be added. You can read more about creating segments here.
Text answers
A good compliment to the cross-tabulations are the text answers. They can be used on their own too, but they will only tell you which purposes the visitors are struggling with, and not which roles that struggle (unless some roles have very specific purposes). For problem areas, the follow-up question to the find questions and the question about improvement suggestions are the most useful.
The text answers are more specific than the cross-tabulations. Instead of telling you that they struggle with, perhaps, product information, a text answer can tell you which exact information or document the visitors cannot find.
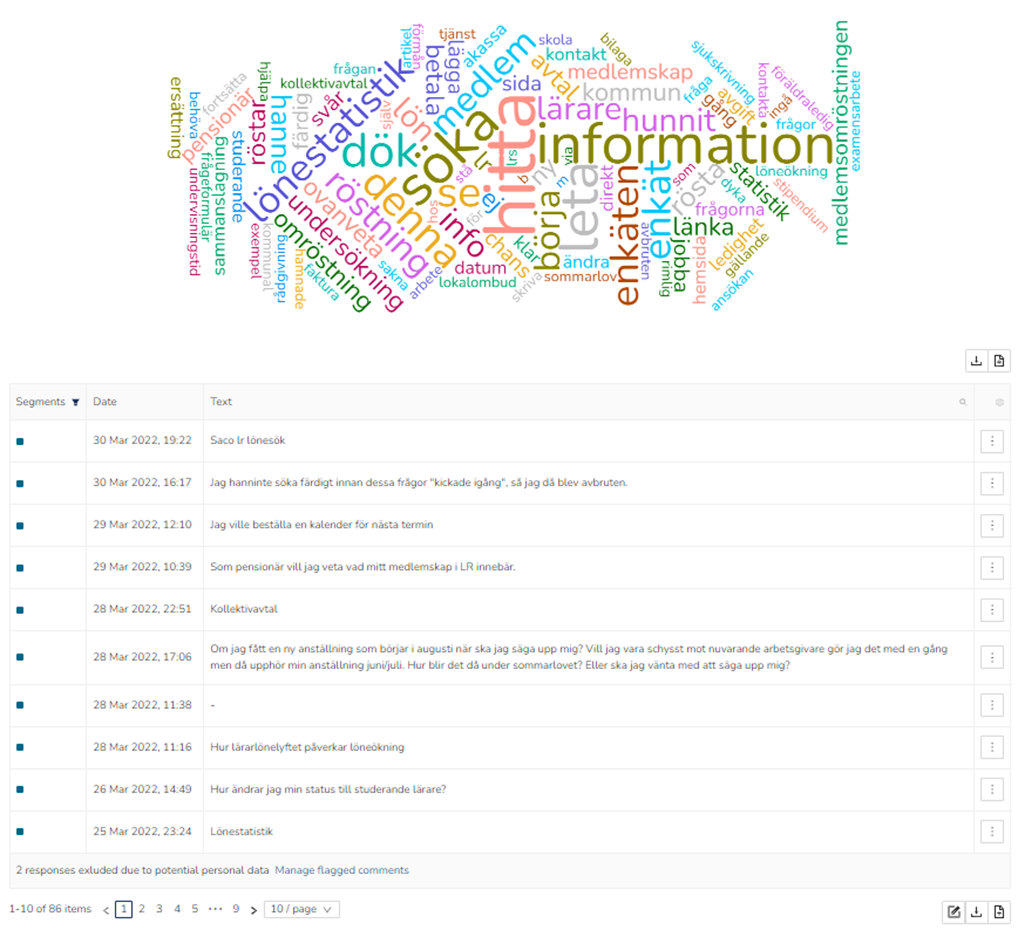
However, text answers can quickly become overwhelming if you have many of them. To get a better overview of the text answers, you should start by tagging the comments, which you can read more about here.
Once you have tagged you text answers, you will get a bar chart showing you a summary of the categories (tags or themes) and the shares. The text answers tell you what the visitors are struggling with, or what they think that you should improve (indirectly, what they struggle with or find problematic).
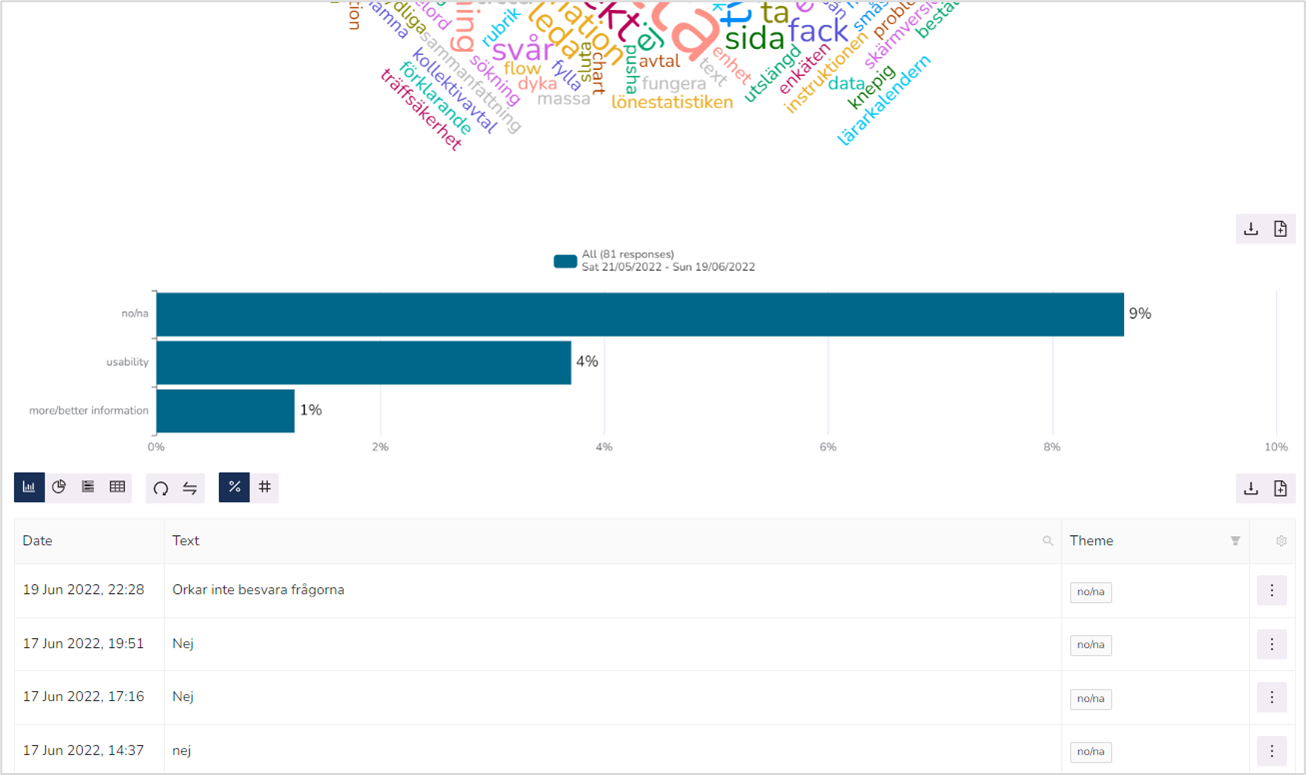
Once you have the problem areas, you can start segmenting on the roles that struggle or the purposes visitors struggle with. Read the text answers to find what exactly causes problems on the website, and use that to find solutions for the visitors' problems.