Instructions on where to find your internal search data and tips and tricks for analyzing it.
The internal search is your visitor’s telling you what they’re looking for, in their own words. It contains valuable insights about what your visitor’s are looking for, how they’re using your search function and how you can improve your site’s navigation and content.
Poorly functioning internal searches is a source to user frustration and can lead to missed revenue, pre-mature exits and bad user experiences.
Here you find your site search reports….

An overview of your individual keywords…
Below is a list of your individual keywords. Note that it separates uppercase and lowercase, like Fruits and fruits, and inflections like apple and apples.
You can see how many within your chosen time period searched for a specific keyword, how many pages of search results it generated and how many who exited without clicking on a search result after their search.
You can hover over a keyword to see the segmented visitor log and the row evolution for that keyword.

… and which pages they landed on
Below is a list of which pages followed a site search. You can see how many clicked on them in search results, how many total pageviews the page has and the average loading time for the page. Note that the total pageviews and the average loading time is including all visitors, not just those who used internal search.
You can hover over a page to see what visitors did before and after viewing the page, see the page performance report and the row evolution for this page.

Search keywords with no results…
To configure this report you need to add a snippet of code, read more here. In the report you see how many searched after the specific keyword, and how many who exited after their search. You can hover over a keyword to see the segmented visitor log and the row evolution for that keyword.

… and what filter/category they chose in the search
If the internal search has a filter or a category selector, Matomo can track which filter/category was used by visitors. You can hover over a category to see the segmented visitor log and the row evolution for that category.

How to gain insights from your internal search data
There is multiple ways you can analyse your search results, but the most common ones are:
Pattern analysis
Pattern analysis is useful to find patterns in your searcher’s behavior, like their tone of voice, use of terms and queries, what type of content they’re looking for and how it differs between different time periods.
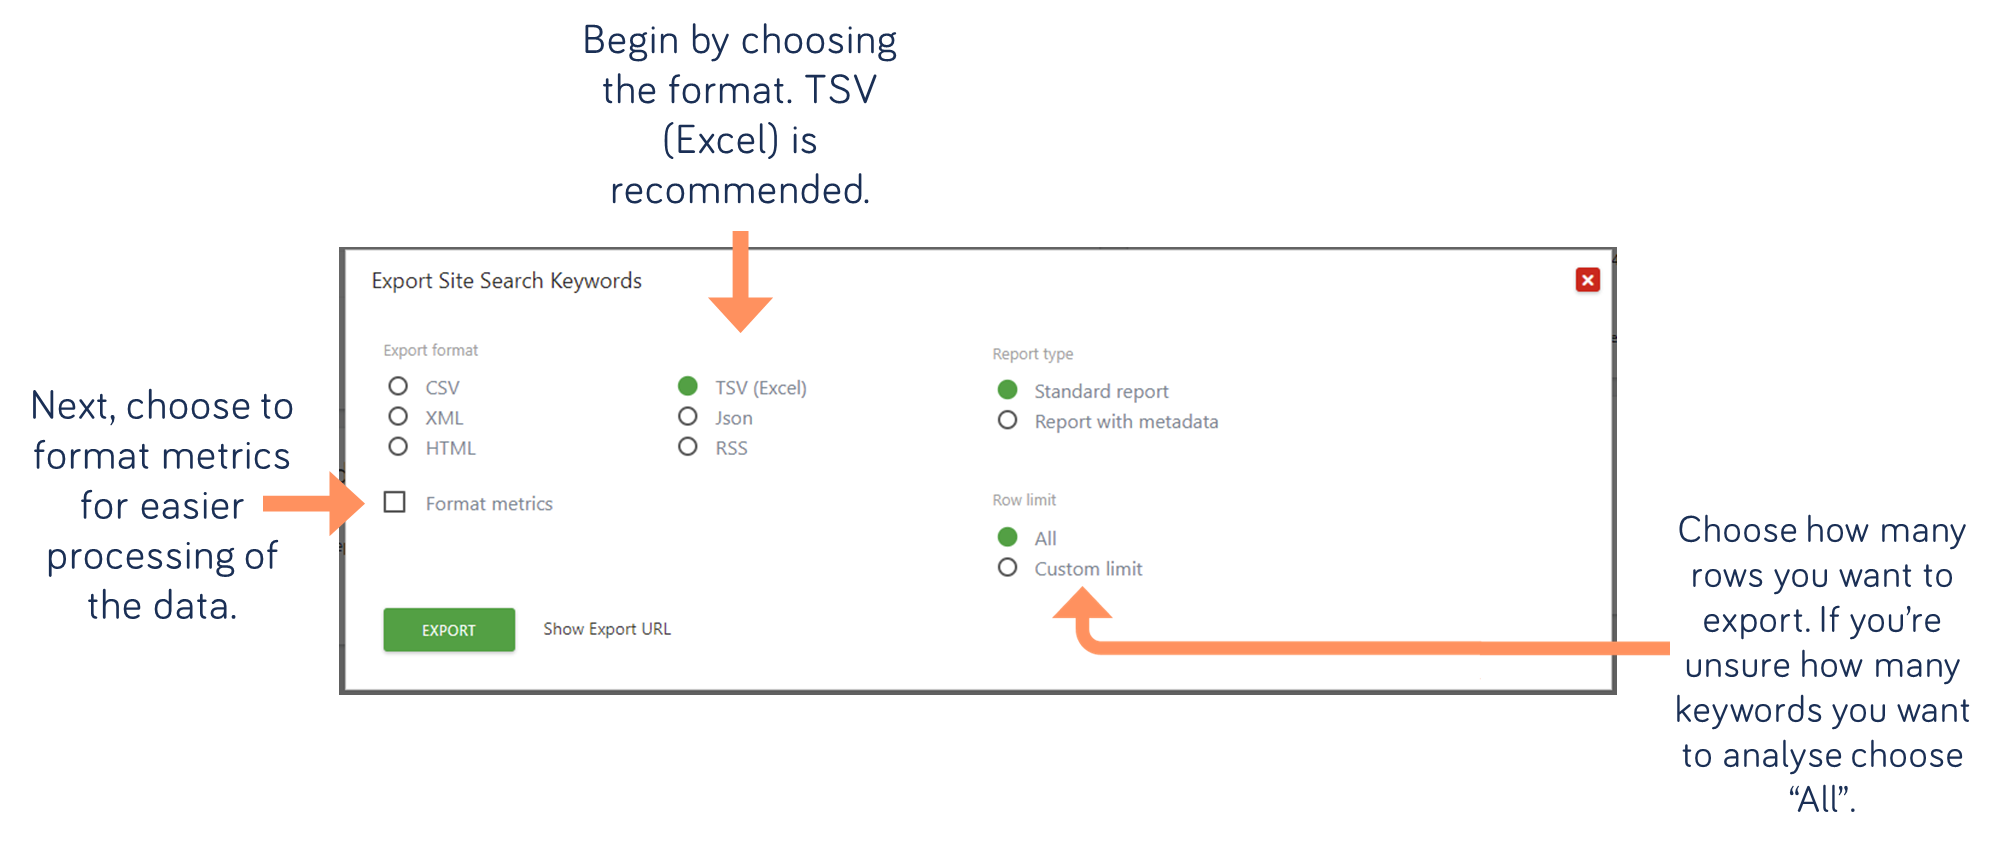
Pattern analysis is easiest done by categorizing your search keywords. This requires you to export your search keywords. Click the button below to export:

… next choose the settings for your export
… find the most popular content by grouping keywords together…
By grouping the most used keywords together, you get a good idea of what your visitors are looking for that period. While we’ve just done the top 50 keywords in this example, you can choose to group more if you want more in-depth information about how your visitors are searching.
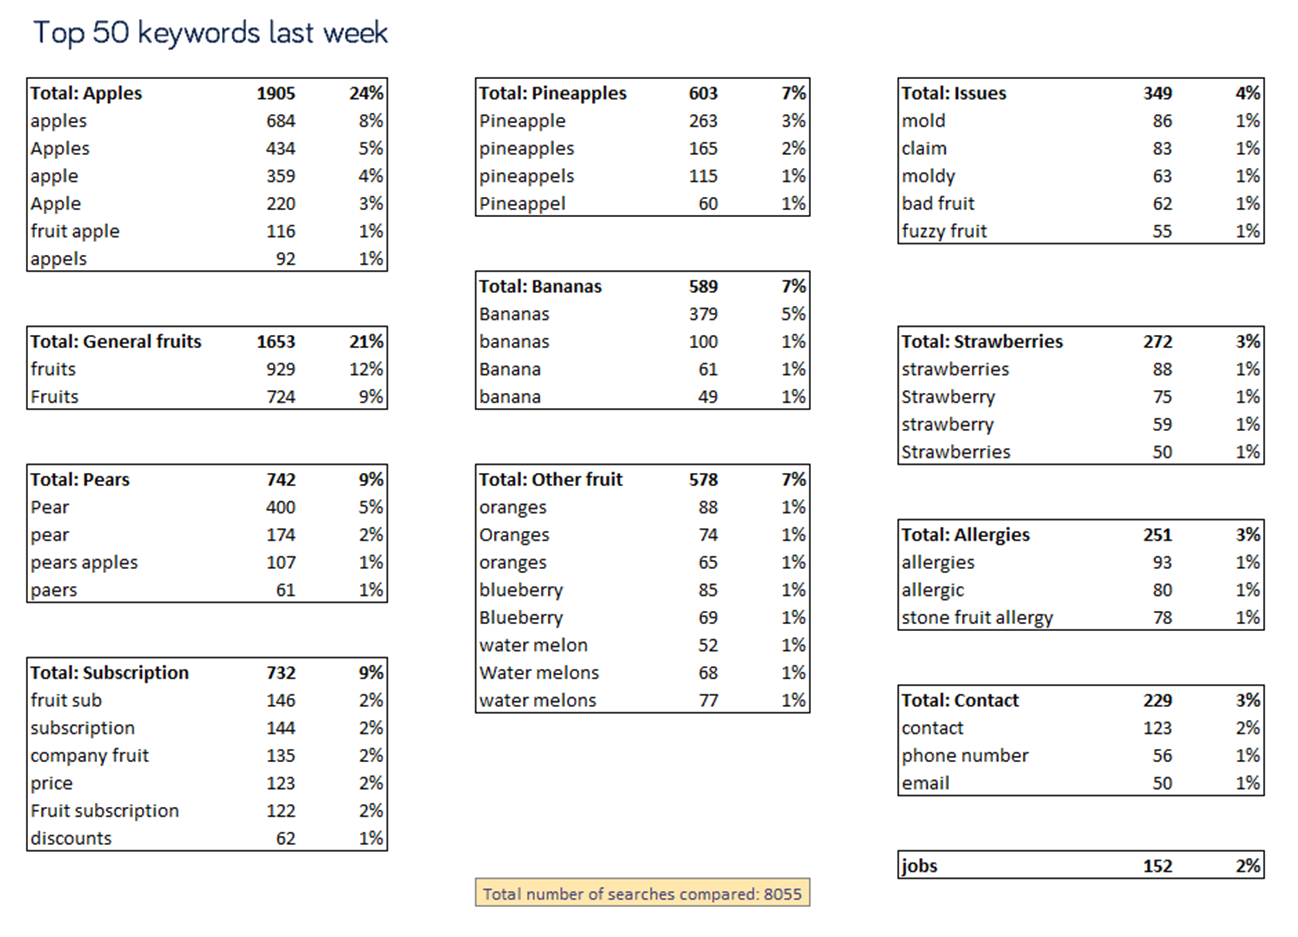
… there is lots of ways to group them together…
Categorizing keywords isn’t an exact science and depending on your company structure, your role and your purpose you may want to categorize keywords differently. For example, sales might be more interested in the different variations of fruit than customer service.

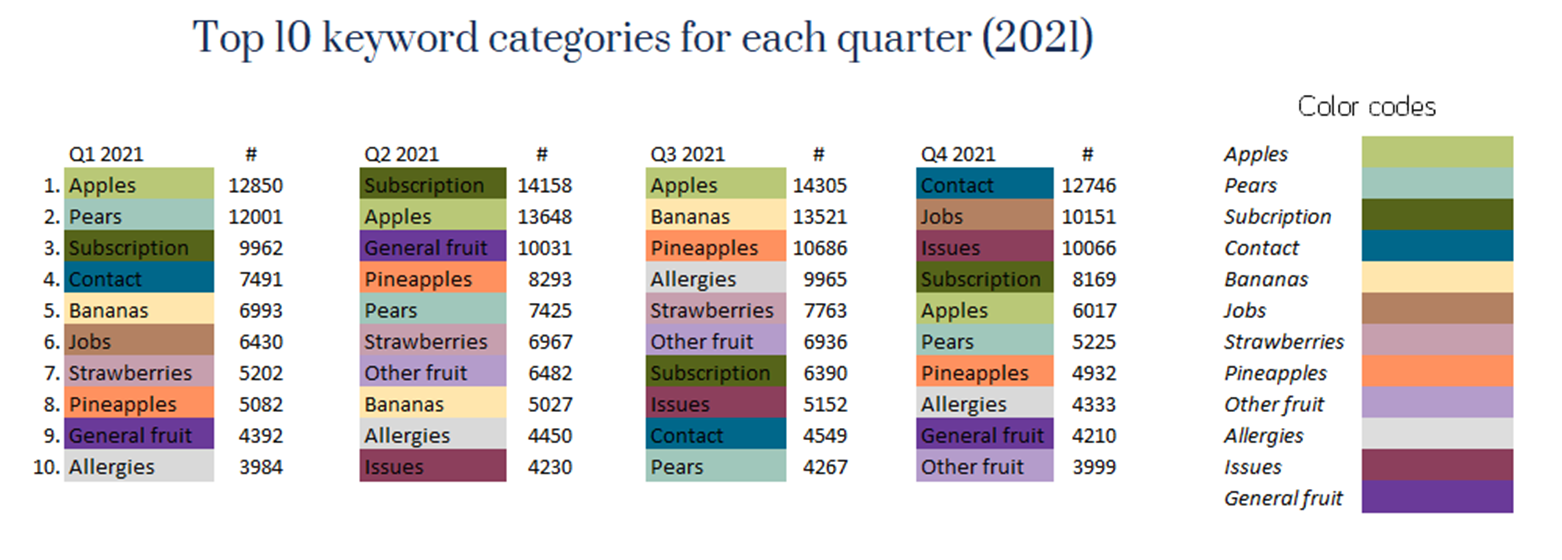
… or find seasonal patterns by comparing different time periods…
By comparing different time periods, you can find seasonal patterns in your keyword categories. In the example above, we can see that visitors search more after contact opportunities during Q4. You can use those insights to strategically place links and widgets so your visitor’s can more easily find them, or to know which content should be created or highlighted on the website.
Failure analysis
Failure analysis can be used to explore which keyword give zero results, keywords that leads to visitor’s giving up and leaving your site and over all how well your internal search is performing.
Begin by using the keywords with no results report…
Using the Search Keywords with No results is the easiest way to perform a failure analysis. A common issue with internal searches is that they’re not indexed to allow for synonyms, spelling errors and inflections.
By checking the visitors log, you can find out more about what your visitor’s did once they didn’t receive any results. Did they continue looking? Did they try a new keyword? Did they leave the site?

… then check your search exit rate…
Start clicking on % search exits, to filter by most search exists. Not all keywords with a high percentage of search exits require action. Look out for multiple searches and relevant keywords to your website.

In this example, we can disregard “football” because it’s only one person who’ve searched for it, and it’s not to our website. But we might be interested in “903758” because it’s the product number to one of our products.
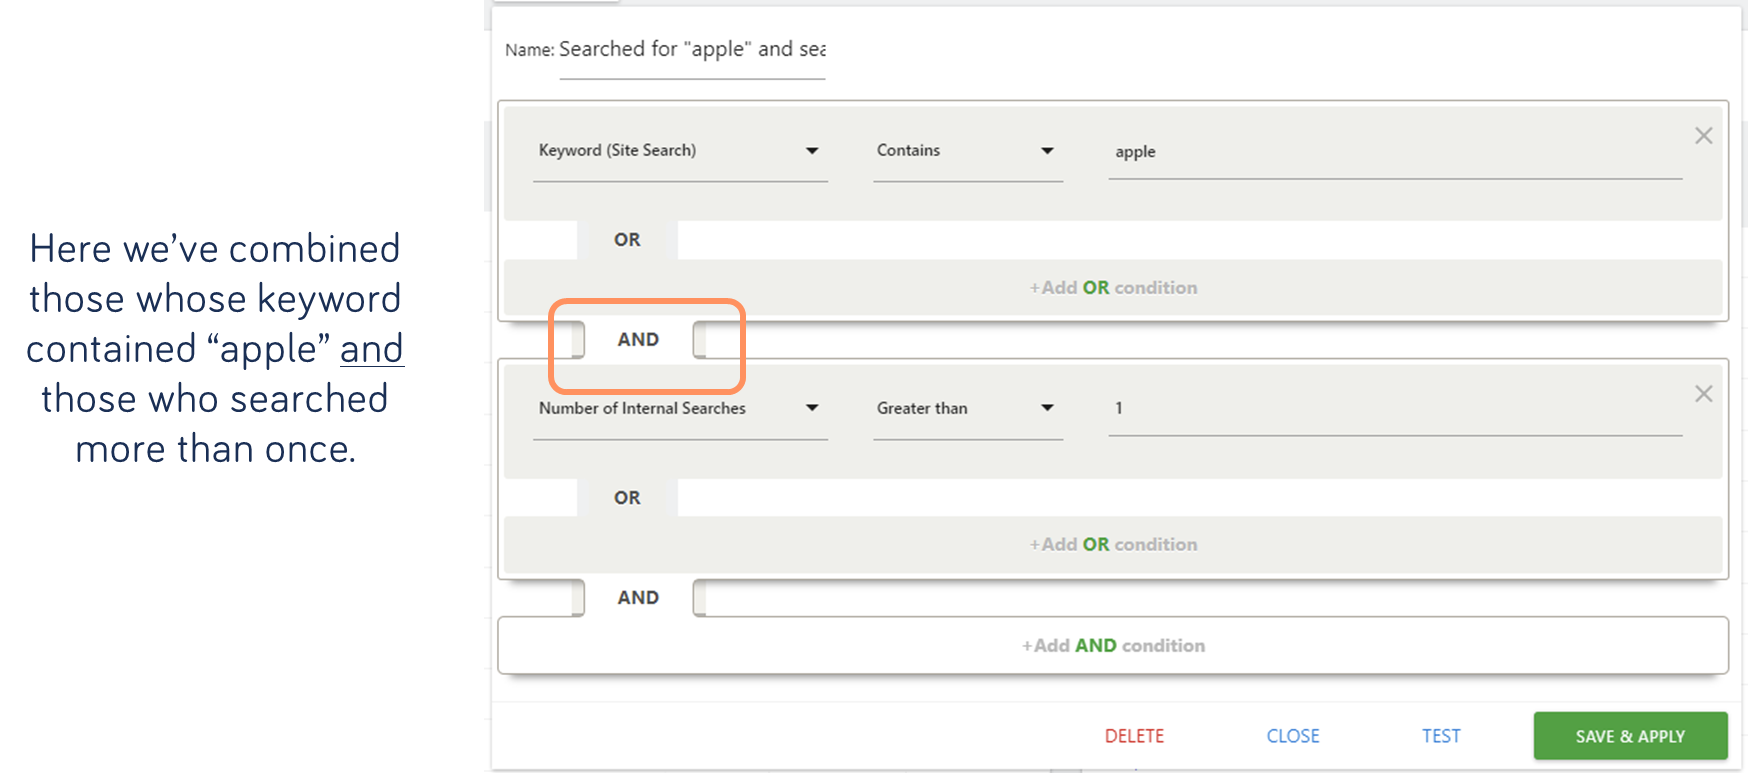
… you can create a segments of visitors who searched more than once…
Create a segment where:
Number of Internal Searches is Greater than 1

Note that this segments all visitors who searched more than once, just not those who struggled to find what they’re looking for. For example, visitor could first be looking for apples and then the phone number without either search have failed.
… find out how well your search is performing by relevance…
Begin by exporting your top keywords and list them. Then, use your internal search to search for each keywords. Look at the top results and assign a number based on the relevance and precision of each result. 
You might have to make some assumptions of what the visitor’s were searching for and what content would be relevant for that keyword.

… add precision and make it into monitorable KPI:s…
Next, you can calculate a percentage for each keyword by implementing different (strict, permissive or loose) criteria.
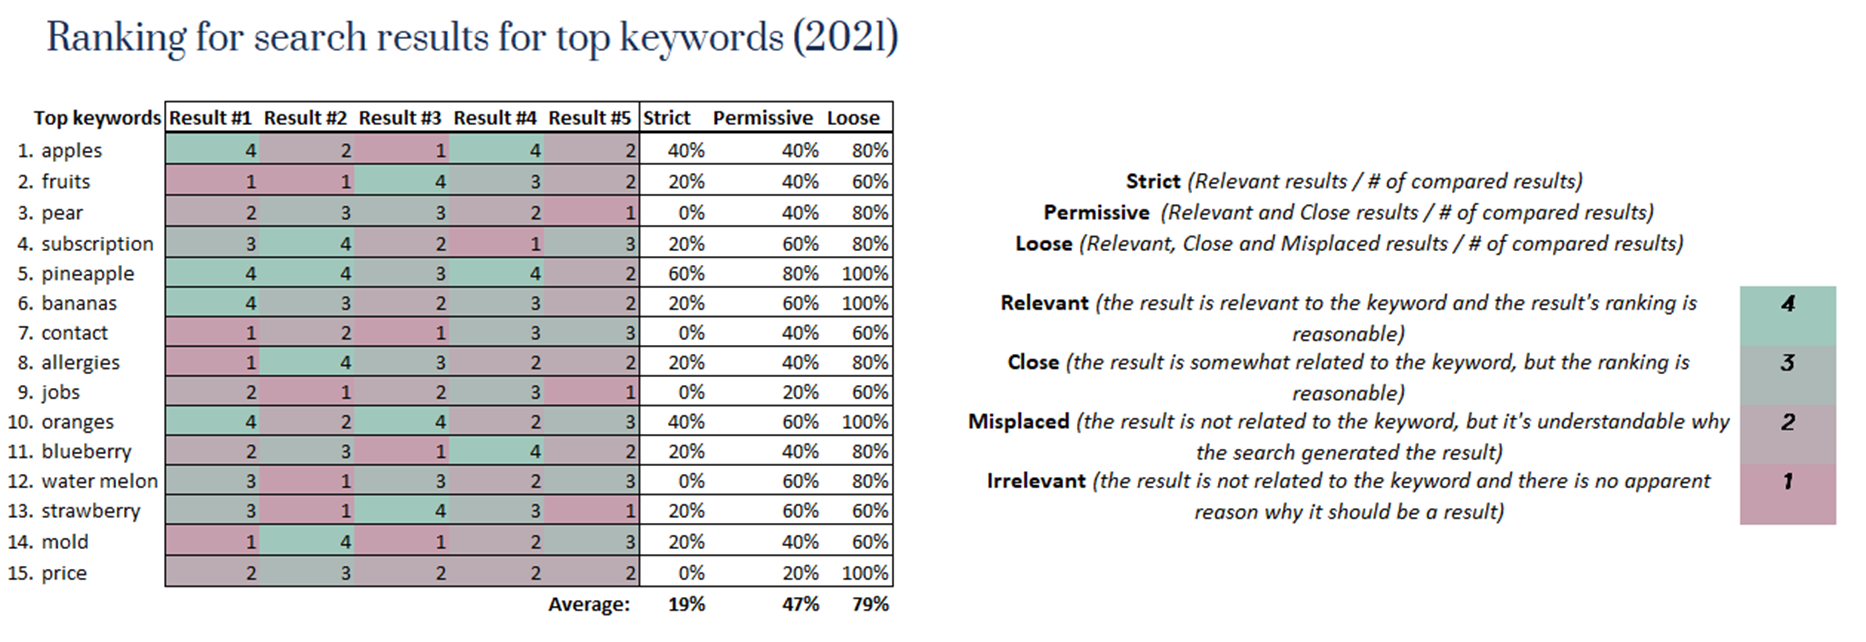

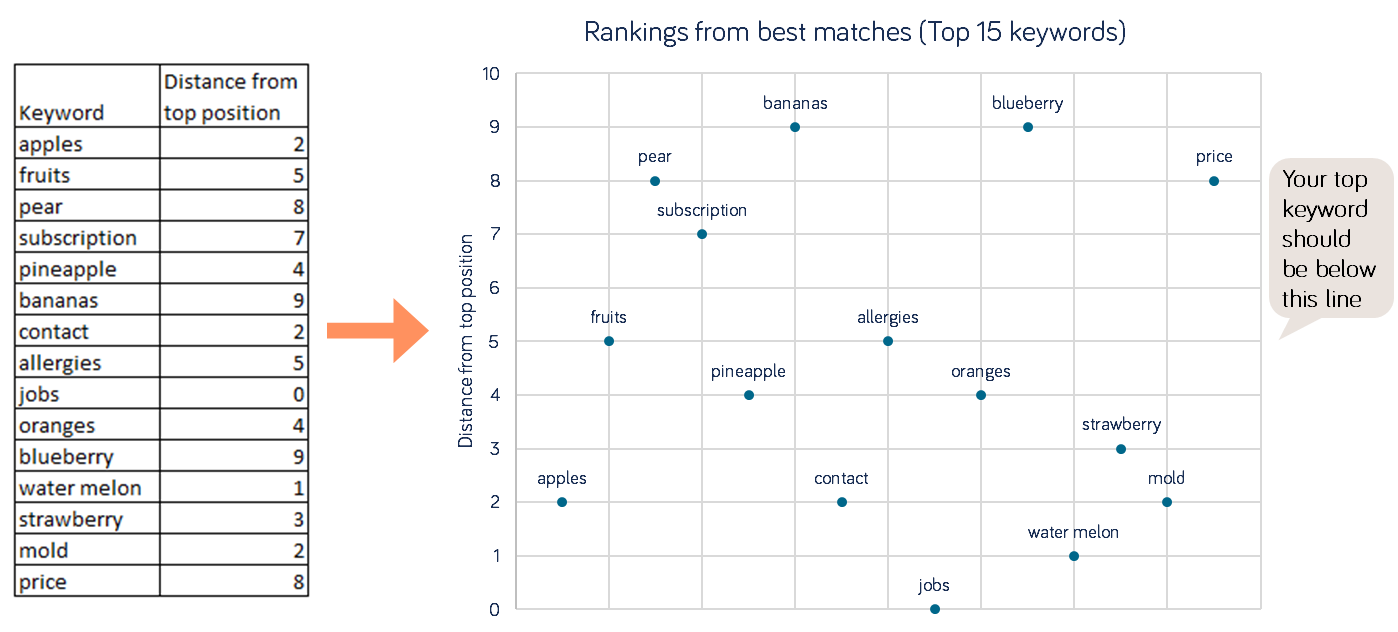
… use a scatter chart to see how well your “perfect” results ranks…
For keywords where a “perfect” or desirable result exists, you can search for the keyword on your site and then make a table with the distance of the result from the top position. Turning it into a scatter chart can give you a good overview of improvement areas.
Session analysis
Analyzing individual sessions can provide more information about what the visitor was trying to find, what they did before and after they used the search and help personalize the searching experience. You can use the “Visitor’s log” next to the keyword or use segments to narrow your scope.
Segment visitors by the keywords they used…
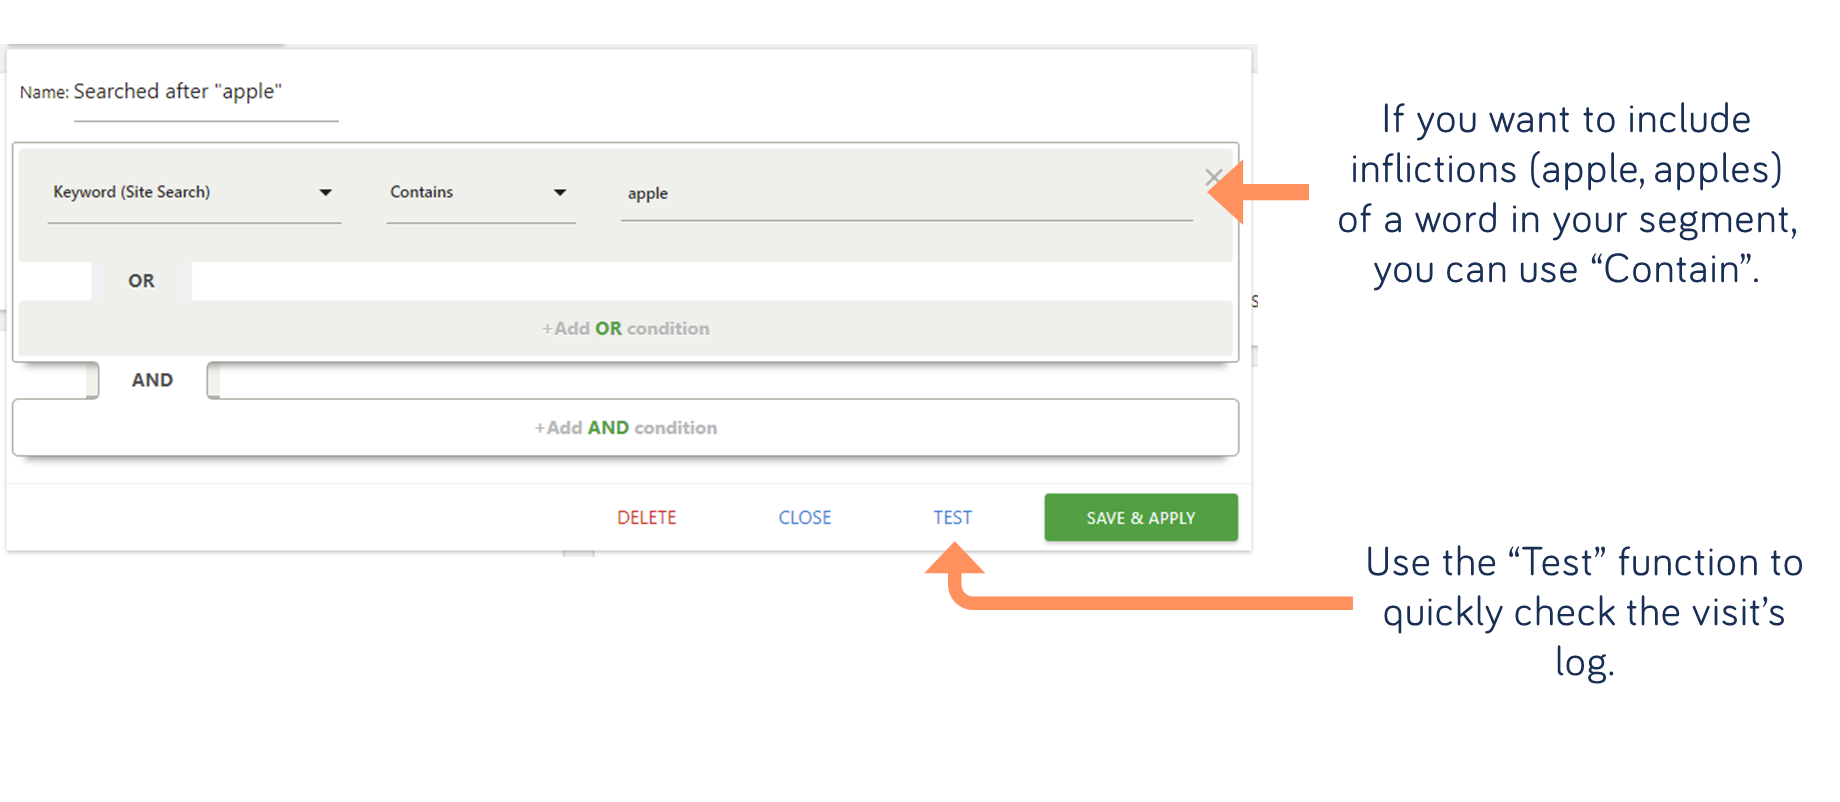
If you have session recordings enabled, you see in real-time how the visitor searched.
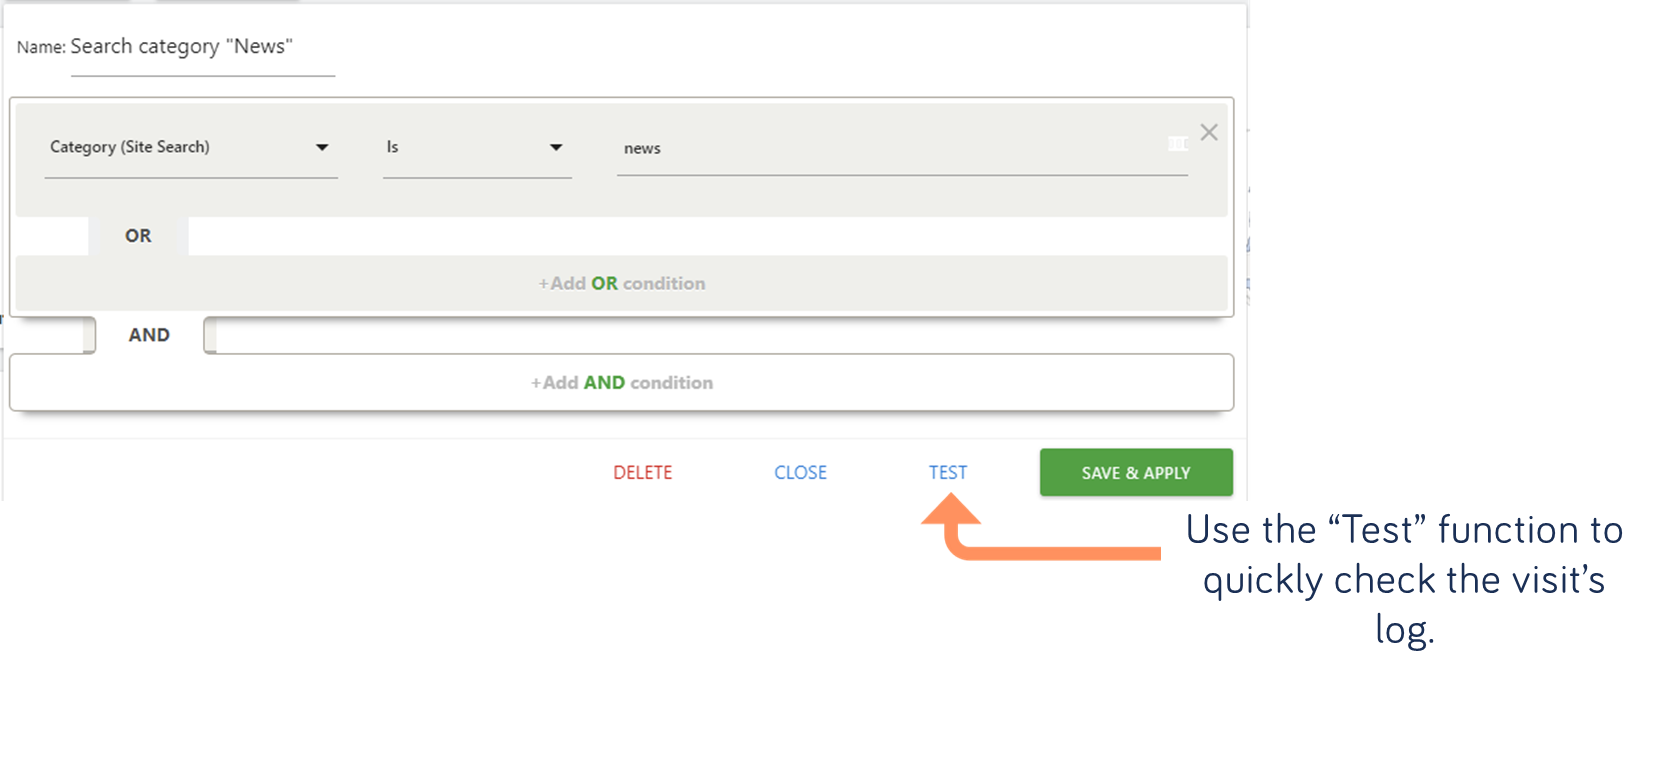
… or segment visitors by the category they used…
Segmenting by the category can help you evaluate how the filter/category selection is working. Is their search exit’s rate lower than for all searchers?
… or combine segments to find visitor’s that are struggling…
… and to find the person behind the search…
Looking at individual visitor logs can give further insights to user behavior. When a visitor searches and receive no results, changes the query and still receive no results, that’s called thrashing. Thrashing is a big source of user frustration and creates a very negative user experience. Finding real examples of lost potential revenue can help motivate changes to the internal search function. 
Audience analysis
Different groups of visitor’s search differently. To find out more about key groups that matter to you, you can use segments.
Suggested segments to try:
A role or purpose from your survey
New and returning visitors
Different channel types - direct traffic, search, website & campaigns
Certain goal or event conversions