
Statistics comes with margins of error, and this article will help you understand changes in your data.
If you are new to statistics, it's easy to exaggerate changes in your data. There are some things that need to be taking into consideration when comparing two time periods, or two sets of data. The number of responses (base) and how big the change is. As a general rule, if you have good bases of fairly equal size, you can consider a difference of 3 percentage points a change. Smaller differences than 3 percentage points are likely to be within the margin of error. However, there are things to consider if you have a small base, bases of different sizes, a multiple choice question, and when comparing KPI questions (which have calculated scores).
What is a good base?
Unfortunately, there is no exact number for what constitutes a good base. Generally, the more answers the better, but a few hundred answers for the selected time period is a good start. The same rule applies to the segments, but having at least 50 responses will show the tendencies.
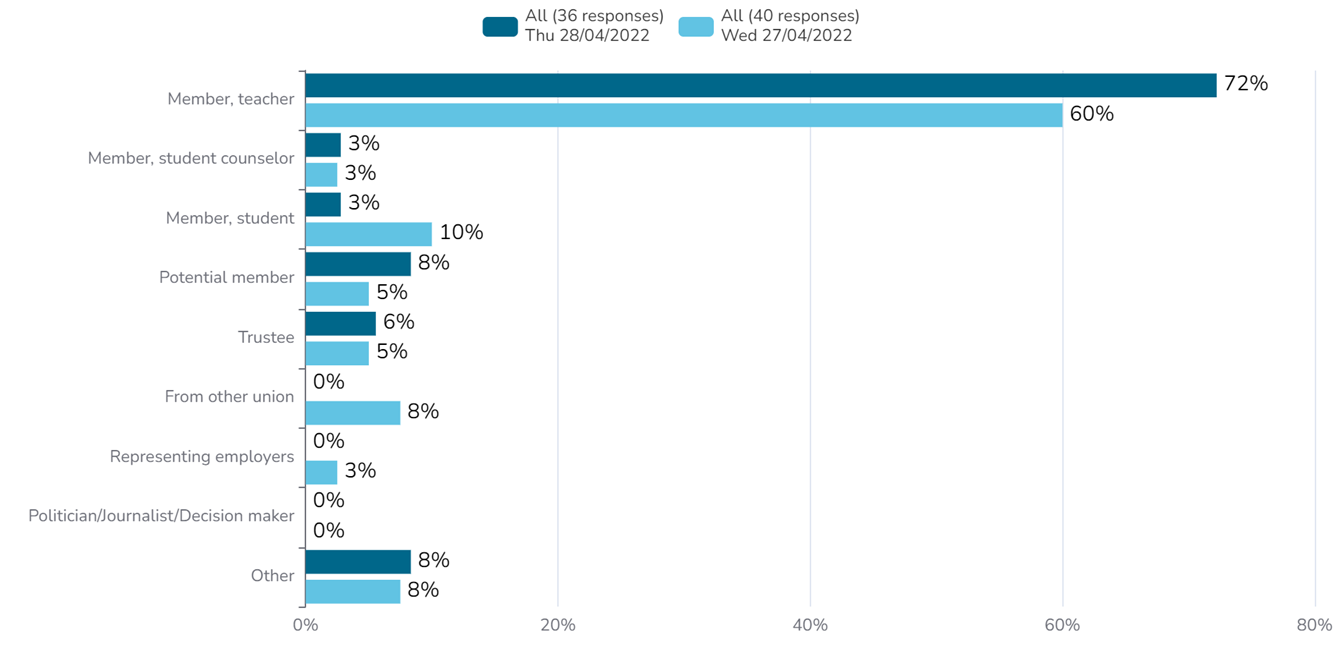
Small base
If you look at a very short time period, have a small website, or are interested in a small visitor category on your website, you may end up with a small base. The problem with small bases is that a single respondent on its own will have a massive impact on the results. In the example below, there seems to be a huge increase of "Member, teacher" as it has increase from 60% to 72%. However, the bases are only around 40 for each time period. The increase is caused by only 2 respondents, and therefore, the increase is not significant even though it is big. The bases are too small.
Bases with different sizes
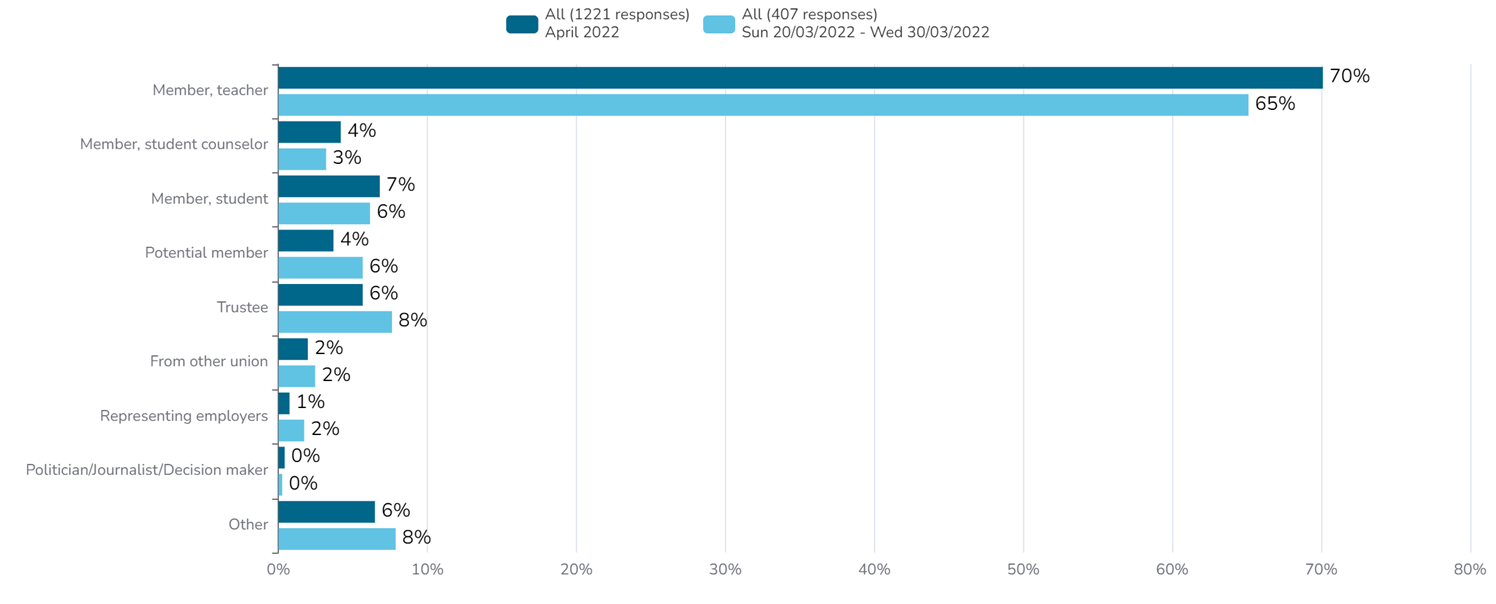
In some cases, perhaps there was a problem with the distribution or the survey was paused for a while, you may end up with bases of different sizes for your time period. And that will affect the analysis. In the example below, one of the time periods has a base three times the size of the other one. There is an increase of the visitor category "Member, teacher". However, with bases of different sizes, that doesn't necessarily mean that there has been a change among your visitors or on your website, but instead it could be that the survey was targeting slightly different groups during the two time periods.
When there are uncertainties about the changes, it helps to look at the trend over a longer time period, and also consider if you have made changes to your website that could be contributing to these changes. But with bases of different sizes, the changes are more likely to be within the margin of error.
Multiple choice questions
Generally, there are a few things to consider when analyzing multiple choice questions. When answering a multiple choice question, the respondents can select more than one option. Multiple choice questions tend to vary a lot more from one time period to the next than single choice questions. An increase doesn't necessarily mean that there is a change on the website or among the visitors, but instead it could be that the respondents answered fewer or more options on average that period, or other differences in how the answer or interpret the question.
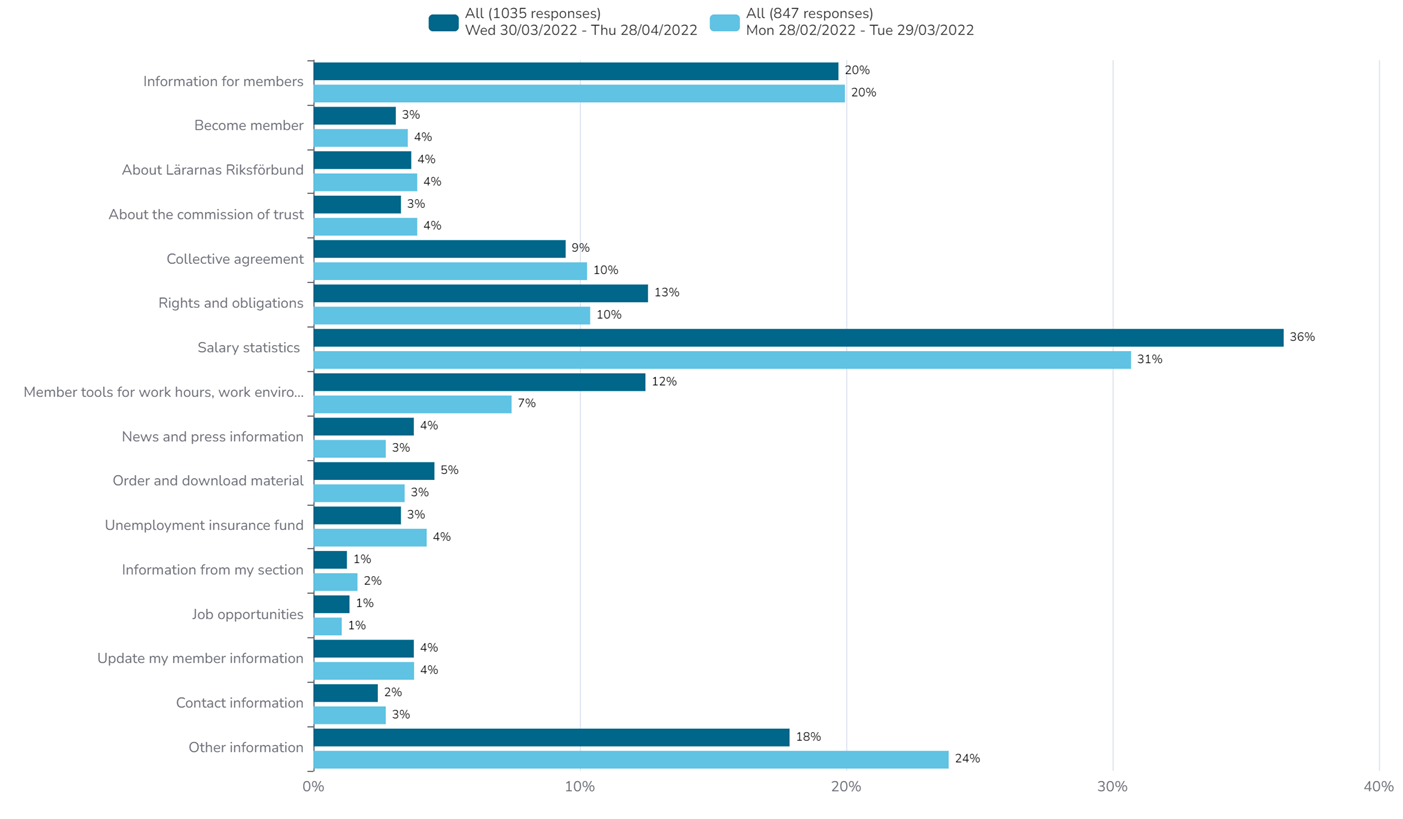
When analyzing multiple choice questions, it's better to focus on bigger differences, such as for "Salary statistics" in the example below. Also, focus more on the bigger alternatives and the tendencies.
Because multiple choice questions are more difficult to analyze, we recommend that you use single choice questions for your purpose question. Ask for the respondents main purposes instead of all of their purposes. That will make it easier to follow and notice changes. Single choice questions also simplify the problem analysis.
KPI questions
The KPI questions have calculated scores, which affects the comparison between time periods. There is also a difference between how the different KPI questions are calculated, and they are therefore divided further.
Find score and NPS
Both find score and NPS are calculated by subtracting the share of negative from the share of positive. There are two things to consider when comparing the two periods: the score and the percentages. In the example below, the score has decreased by 5. However, for smaller differences it can be difficult to know if they are within the margin of error or if they are noteworthy. In the example below we have good bases and the share of "Yes" has decreased by 5 percentage points. Using the general guideline of a difference of at least 3 percentage points, this example would be considered a decrease.
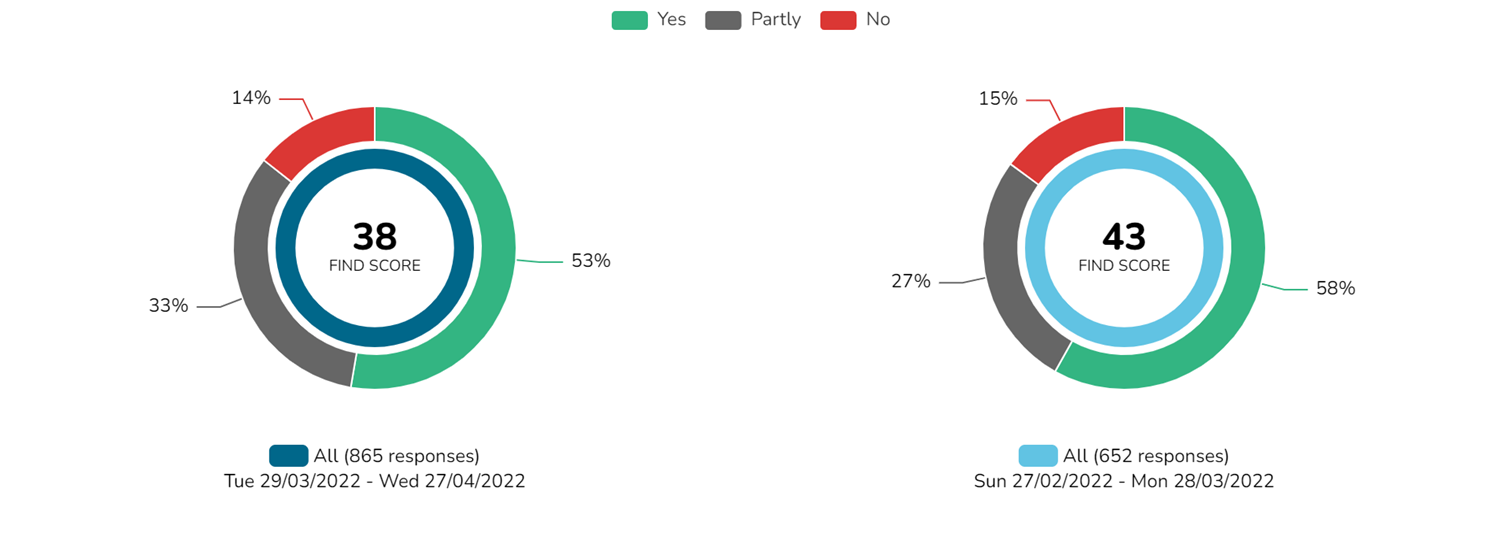
The general rule for NPS and find score is to compare the percentages rather than the score. If the percentages are about the same but the score different, it is likely to be within the margin of error.
Ratings
The rating questions differ from the other questions as they are only presented as scores (if you want to use the summary chart, there are also individual charts for each rating question which will show you percentages as well). The rating scale is 1-5, and differences smaller than 0.1 are considered to be within the margin of error. The biggest difference in the example below (Content) is 0.06, and therefore the two time periods are considered to have the same ratings.
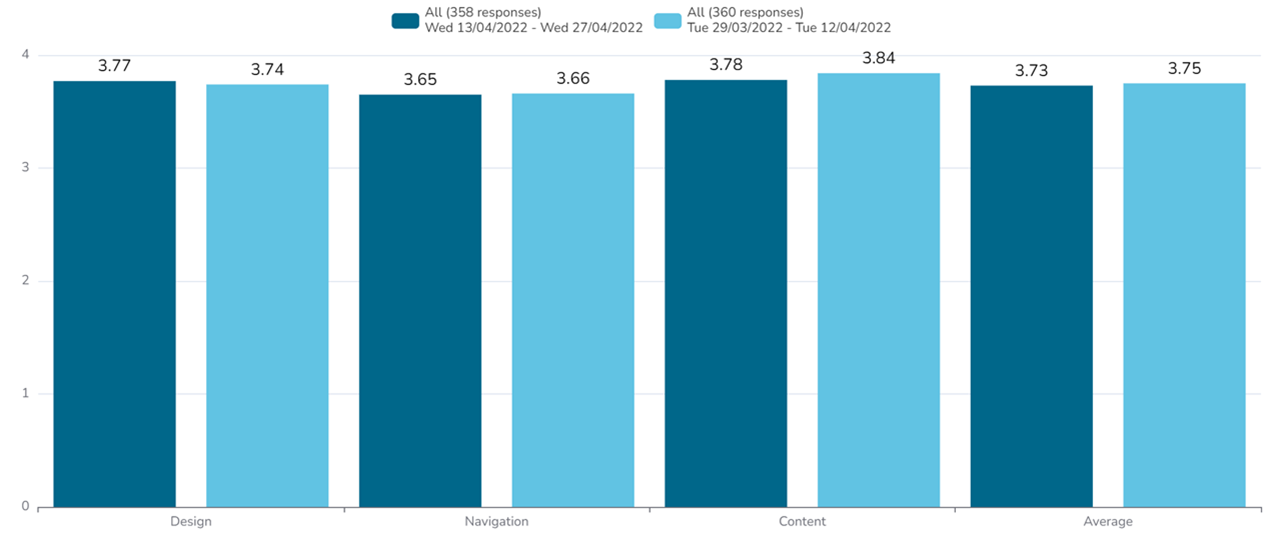
However, for rating questions you can sometimes have differences smaller than 0.1 that are part of a negative of positive trend. Therefore, it is always good to consider the trend also.
Statistically significant changes
This article tells you how to analyze your data without testing the statistical significance. Those test consider both the size of the bases and how big the difference is, and will then tell you if the change is statistically significant. We are currently not offering this type of test in our platform. However, if statistical significance is important to you, there are free tests available online, and you can find all the information you need to conduct the test in our platform, such as number of responses.